

- Gold Prices Drop Over 1% Amid Strengthening US Dollar and Rising Fed Rate-Cut Expectations
- XAU/USD Plummets to $2,845 as Investors Anticipate Federal Reserve Rate Cuts
- US President Trump Imposes 25% Tariffs on Imports from Mexico and Canada, Increasing Market Volatility
- Federal Reserve Predicted to Reduce Interest Rates by 70 Basis Points in 2025, Starting in June
On Friday, gold prices fell sharply by more than 1%, culminating in a weekly decline of over 3%. The US Dollar climbed to a ten-day high of 107.66, driven by escalating trade policy concerns in the United States and economic data indicative of a looming recession. The XAU/USD pair is currently trading at $2,845, after peaking earlier in the day at $2,885.
President Donald Trump recently announced that starting March 4, a 25% tariff will be imposed on goods from Mexico and Canada. Moreover, the latest data from the Federal Reserve’s preferred inflation measure, the Core Personal Consumption Expenditures (PCE) Price Index, suggests that inflation is inching closer to the Fed’s 2% target.
Market expectations for the Federal Reserve to ease monetary policy have intensified following the release of this data. Prime Market Terminal forecasts a total reduction in interest rates of 70 basis points this year, with the initial cut expected in June.
Additionally, the Atlanta Fed’s GDPNow model for Q1 2025 has been revised, now predicting a contraction of 1.5%, a significant downturn from the previous estimate of a 2.3% expansion. This revision led to a slight drop in the yield of the 10-year US Treasury note by three basis points, while the US Dollar gained strength amid concerns over a potential recession.
Comments from Federal Reserve officials also made headlines. Cleveland Fed’s Beth Hammack remarked that a rate hike is currently off the table, and the impact of recent trade policies on both monetary policy and the economy remains unclear.
Daily Market Digest: Gold Struggles as Fears of US Recession Grow
- The core PCE in the US increased by 0.3% month-over-month from December and rose by 2.6% year-over-year, a slight decrease from December’s 2.8% rise.
- The headline PCE also saw a year-over-year increase of 2.5%, aligning with expectations, and maintained a steady monthly growth rate of 0.3%.
- Market participants are also reacting to President Trump’s recent tariff declarations, which include a 25% tariff on Mexican and Canadian imports and an additional 10% on Chinese goods.
- The yield on the US 10-year Treasury note currently stands at 4.229%, which has helped limit further declines in gold prices. Meanwhile, US real yields, as indicated by the 10-year Treasury Inflation-Protected Securities (TIPS), have decreased by five basis points to 1.853%.
- Goldman Sachs has updated its gold price forecast, now predicting a rise to $3,100 by the end of 2025.
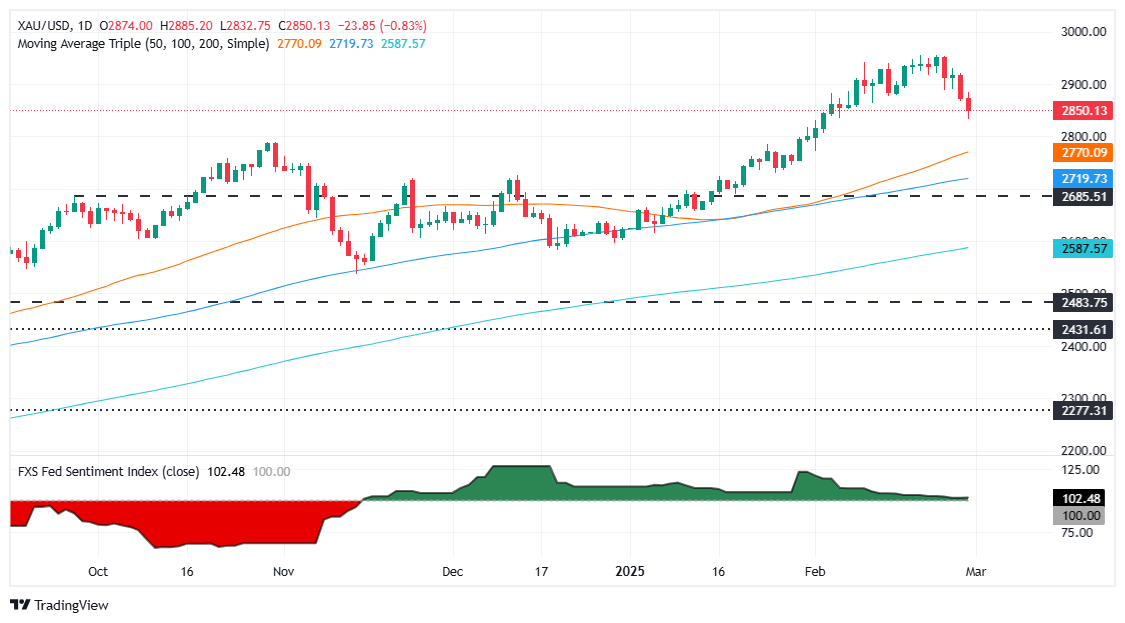
XAU/USD Technical Analysis: Gold Continues to Face Downward Pressure Below $2,850
Gold prices have exhibited a bearish trend with consecutive downward movements, indicating that traders are likely taking profits and rebalancing their portfolios as the weekend and month-end approach. After breaking below the $2,900 level, XAU/USD continued its descent towards $2,832, though a daily close above $2,850 might provide some optimism for a recovery.
Should the price stabilize, the first resistance level for XAU/USD is expected at $2,900, followed by the year-to-date high of $2,956. On the downside, key support levels to watch include $2,800, the October 31 peak at $2,790, and the 50-day Simple Moving Average (SMA) at $2,770.


Recent News


Leave a Comment