

- The Australian Dollar maintains stability despite mixed economic indicators from China.
- China’s Consumer Price Index (CPI) fell slightly by 0.1% in May, less than the anticipated 0.2% decrease.
- US Treasury Secretary Scott Bessent is scheduled for discussions with Chinese representatives today.
The Australian Dollar (AUD) experienced a slight increase against the US Dollar on Monday, rebounding from earlier losses. The AUD/USD pair gained strength after China, a major trading partner of Australia, released crucial economic data.
The National Bureau of Statistics of China noted that the Consumer Price Index (CPI) decreased by 0.1% yearly in May, following a similar decline in April. This was less than the market’s expectation of a 0.2% fall. Additionally, China’s CPI inflation decreased by 0.2% month-over-month, compared to a 0.1% increase in April. The Producer Price Index (PPI) in China also showed a continued decline, falling 3.3% annually in May after a 2.7% drop in April.
China’s Trade Balance for May showed a surplus of CNY743.56 billion, an increase from CNY689.99 billion previously. However, exports grew by 6.3% year-over-year, down from 9.3% in April, while imports declined by 2.1% year-over-year.
Market participants are closely watching the upcoming US-China trade talks. Following an agreement between US President Donald Trump and Chinese President Xi Jinping to resume discussions, US Treasury Secretary Scott Bessent and other officials are set to meet with Chinese counterparts today.
Reserve Bank of Australia (RBA) Assistant Governor Sarah Hunter expressed concerns that higher US tariffs could adversely affect the global economy, potentially impacting investment, output, and employment in Australia.
Australian Dollar rises as US Dollar weakens
- The US Dollar Index (DXY), which tracks the US Dollar against a basket of major currencies, was lower, trading around 99.00. However, it found some support from positive US employment data for May, released last Friday.
- The US Bureau of Labor Statistics reported that Nonfarm Payrolls increased by 139,000 in May, surpassing the expected 130,000. The Unemployment Rate remained stable at 4.2%, and Average Hourly Earnings were unchanged at 3.9%, both better than anticipated.
- This robust job data has increased the likelihood that the Federal Reserve will maintain its current interest rates in the upcoming monetary policy meetings.
- President Trump has publicly urged Federal Reserve Chairman Jerome Powell to lower interest rates, criticizing the delay in rate adjustments compared to Europe.
- Amidst economic uncertainties, Minneapolis Fed President Neel Kashkari emphasized the need for a cautious approach, suggesting the Fed should wait and see how the economy responds.
- House Republicans have passed a significant tax and spending bill, which might increase the US fiscal deficit and keep bond yields higher for an extended period. This development has sparked concerns about the health of the US economy and led to a trend of selling American assets.
- Australia’s Trade Balance showed a surplus of 5,413M in April, below expectations. Exports decreased by 2.4% month-over-month, while imports rose by 1.1%. The Caixin Services PMI in China indicated an expected increase to 51.1 in May from 50.7 in April.
- The Australian Bureau of Statistics reported that GDP grew by 0.2% quarter-over-quarter in Q1, below the anticipated 0.4% increase. The annual growth rate was also lower than expected at 1.3%.
Australian Dollar climbs above 0.6500, reaching a seven-month peak
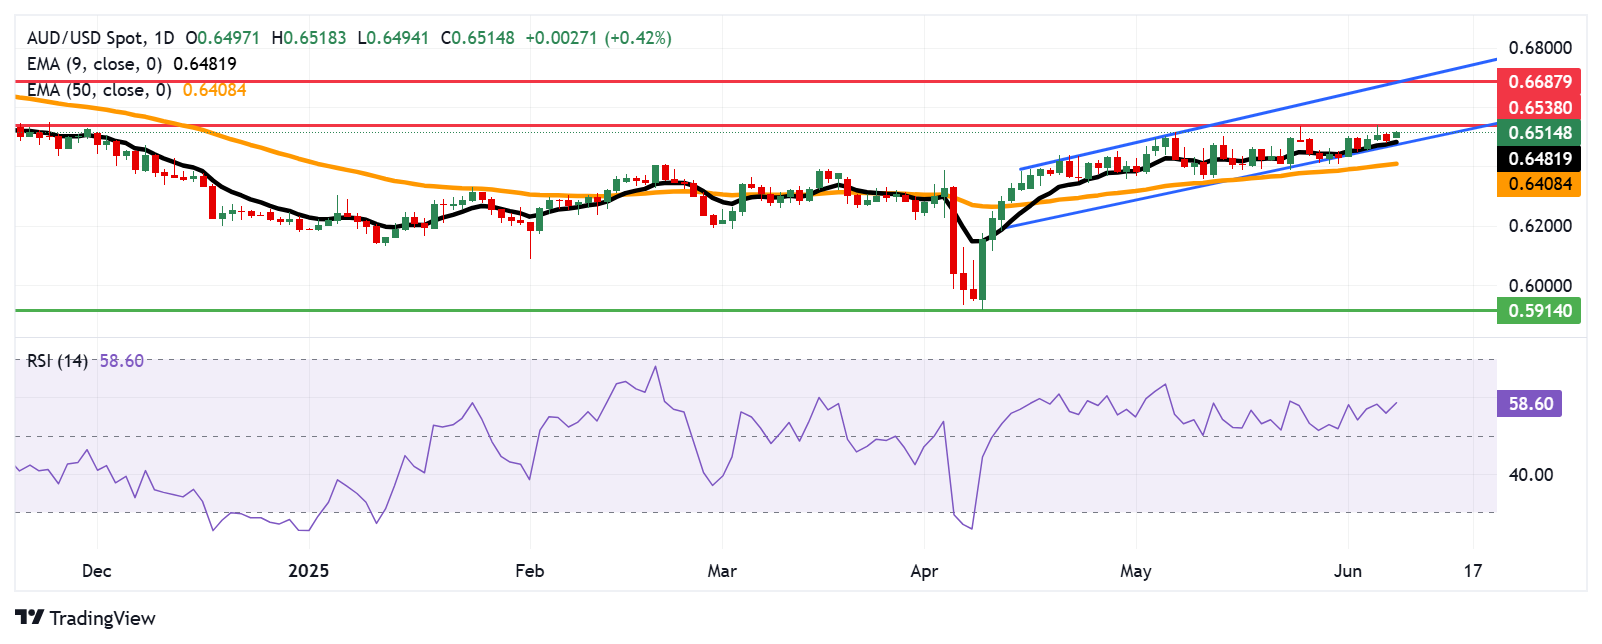
The AUD/USD pair is trading around 0.6510, showing a continued upward trend within an ascending channel pattern. The pair remains above the nine-day Exponential Moving Average (EMA), indicating strong short-term momentum. The 14-day Relative Strength Index (RSI) is above 50, supporting a bullish outlook.
The pair might encounter resistance at the recent seven-month high of 0.6538. A breakthrough could lead to further gains towards the upper boundary of the channel, around 0.6680, close to the eight-month high of 0.6687.
Conversely, the main support level is at the nine-day EMA of 0.6481, near the lower boundary of the ascending channel. A drop below this critical support zone could weaken the bullish sentiment, potentially driving the pair down to the 50-day EMA at 0.6408.
AUD/USD: Daily Chart
Australian Dollar PRICE Today
The table below shows the percentage change of Australian Dollar (AUD) against listed major currencies today. Australian Dollar was the strongest against the US Dollar.
| USD | EUR | GBP | JPY | CAD | AUD | NZD | CHF | |
|---|---|---|---|---|---|---|---|---|
| USD | -0.15% | -0.19% | -0.26% | -0.07% | -0.22% | -0.29% | -0.04% | |
| EUR | 0.15% | -0.05% | -0.12% | 0.07% | -0.06% | -0.15% | 0.09% | |
| GBP | 0.19% | 0.05% | 0.02% | 0.12% | 0.00% | -0.10% | 0.14% | |
| JPY | 0.26% | 0.12% | -0.02% | 0.19% | -0.03% | -0.10% | 0.09% | |
| CAD | 0.07% | -0.07% | -0.12% | -0.19% | -0.17% | -0.22% | 0.02% | |
| AUD | 0.22% | 0.06% | -0.01% | 0.03% | 0.17% | -0.10% | 0.16% | |
| NZD | 0.29% | 0.15% | 0.10% | 0.10% | 0.22% | 0.10% | 0.24% | |
| CHF | 0.04% | -0.09% | -0.14% | -0.09% | -0.02% | -0.16% | -0.24% |
The heat map shows percentage changes of major currencies against each other. The base currency is picked from the left column, while the quote currency is picked from the top row. For example, if you pick the Australian Dollar from the left column and move along the horizontal line to the US Dollar, the percentage change displayed in the box will represent AUD (base)/USD (quote).


Recent News


Leave a Comment