

- EUR/USD Gains 0.36%, Poised to Close Week Steady Amid Delayed US Military Action in Iran.
- Contrasting Views on Rate Cuts: Waller Supports July Reduction, Diverging from Fed’s Report and Barkin’s Cautious Approach.
- EU-US Trade Agreement Uncertain as July 9 Deadline Approaches, Limiting EUR/USD Upside.
The Euro shows a recovery against the US Dollar, stabilizing to end the week nearly unchanged as risk appetite wanes. This market sentiment shift occurs despite President Trump’s postponement of military actions in the Israel-Iran conflict. Currently, the EUR/USD is trading at 1.1534, marking a 0.36% increase.
Negative shifts in market sentiment have been influenced by US trade policies that limit chipmakers with operations in China, following a senior US official’s move to end waivers, which led to a significant drop in major US indices. Meanwhile, Trump’s preference for diplomacy over military engagement, delaying potential conflict for two weeks, has provided some support for the Euro. However, Iran has declared it will not engage in negotiations while hostilities with Israel persist.
The Euro also received a boost from Federal Reserve Governor Christopher Waller’s endorsement of a rate cut in July. In contrast, the Fed’s monetary policy report suggests the current policy is appropriate given the uncertainty of external shocks, while Richmond Fed President Thomas Barkin has advocated for a more patient approach to rate adjustments.
However, the potential failure to secure a trade deal between the European Union (EU) and the United States could pressure EUR/USD as the July 9 deadline looms.
On the economic data front, the EU’s Consumer Confidence index underperformed expectations, yet traders overlooked the disappointing results, pushing EUR/USD higher.
Euro PRICE This week
The table below shows the percentage change of Euro (EUR) against listed major currencies this week. Euro was the strongest against the Canadian Dollar.
| USD | EUR | GBP | JPY | CAD | AUD | NZD | CHF | |
|---|---|---|---|---|---|---|---|---|
| USD | 0.18% | 0.88% | 1.05% | 1.17% | 0.53% | 0.88% | 0.80% | |
| EUR | -0.18% | 0.59% | 0.86% | 1.00% | 0.49% | 0.71% | 0.62% | |
| GBP | -0.88% | -0.59% | 0.29% | 0.41% | -0.11% | 0.12% | 0.04% | |
| JPY | -1.05% | -0.86% | -0.29% | 0.11% | -0.82% | -0.54% | -0.66% | |
| CAD | -1.17% | -1.00% | -0.41% | -0.11% | -0.56% | -0.29% | -0.37% | |
| AUD | -0.53% | -0.49% | 0.11% | 0.82% | 0.56% | 0.23% | 0.14% | |
| NZD | -0.88% | -0.71% | -0.12% | 0.54% | 0.29% | -0.23% | -0.08% | |
| CHF | -0.80% | -0.62% | -0.04% | 0.66% | 0.37% | -0.14% | 0.08% |
The heat map shows percentage changes of major currencies against each other. The base currency is picked from the left column, while the quote currency is picked from the top row. For example, if you pick the Euro from the left column and move along the horizontal line to the US Dollar, the percentage change displayed in the box will represent EUR (base)/USD (quote).
Daily Market Digest: EUR/USD Defies Fed’s Hawkish Outlook and Rallies
- Geopolitical dynamics continue to influence market trends, which so far have supported further appreciation of the US Dollar. In a risk-off scenario, the EUR/USD is likely to face downward pressure, even as the “Sell America” sentiment persists.
- Recent data from the US indicates a cooling economy, with the Philadelphia Fed Manufacturing Index remaining at -4 in June, consistent with May’s figures and below the anticipated slight improvement to -1.
- Fed Chair Jerome Powell maintains a wait-and-see approach, stating that the current policy is modestly restrictive. He emphasized that as long as the labor market remains robust and inflation cools, maintaining current rates is the “right course of action.”
- This week, the Fed maintained interest rates at 4.25%-4.50%. Fed officials revised their economic forecasts, lowering the GDP growth expectation for 2025 to 1.4% from 1.7% in March, and adjusting the Unemployment Rate forecast upward to 4.5% from 4.4%, with a slight increase in the core PCE inflation estimate to 3.1% from 2.8%.
- EU Consumer Confidence in June dropped to -15.3, falling short of the anticipated improvement to -14.5.
- Market participants are skeptical about the European Central Bank’s likelihood of reducing its Deposit Facility Rate by 25 basis points at the upcoming July monetary policy meeting.
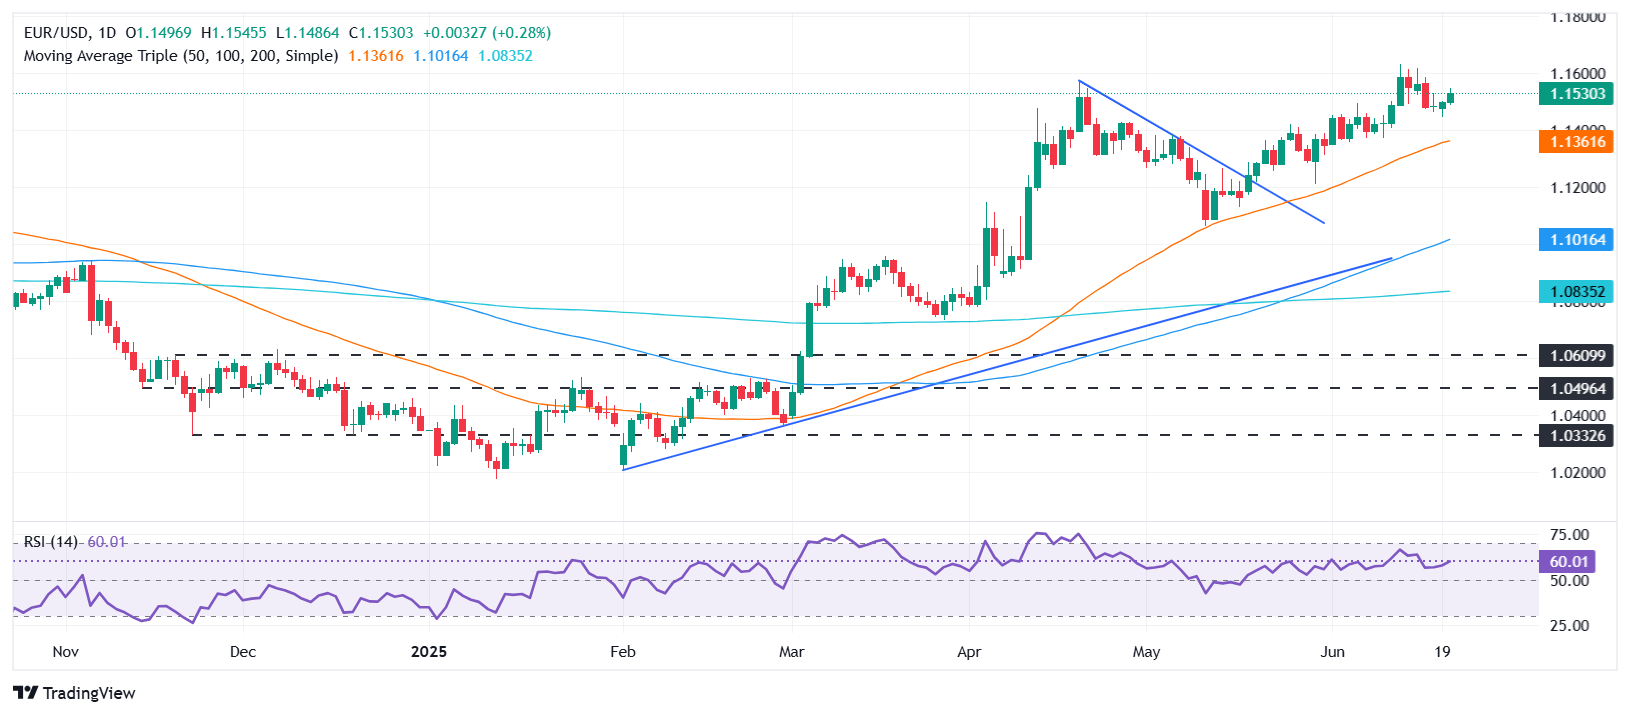
Euro Technical Analysis: EUR/USD Surpasses 1.1500, Aiming for 1.1550
The upward trend for EUR/USD continues, with technical indicators suggesting a strengthening position. The appearance of a “morning star” candlestick pattern indicates a gathering momentum among buyers, aiming to push the exchange rate higher. The Relative Strength Index (RSI) supports this view, trending upwards after a brief pause.
The immediate resistance for EUR/USD is at 1.1550. Breaking this level could lead to testing 1.1600, then potentially reaching the year-to-date high of 1.1631. On the downside, a daily close below 1.1500 could lead to a retest of 1.1450, with subsequent support at the 20-day Simple Moving Average (SMA) at 1.1438, followed by 1.1400.


Recent News


Leave a Comment