

- Australian Dollar Falls Following China’s Trade Data Release
- BHP and CATL Forge Partnership Amidst Global Trade Tensions
- New Tariffs Announced by Trump to Impact Global Trade
The Australian Dollar (AUD) experienced a decline against the US Dollar (USD) after the release of disappointing trade balance data from China. The AUD/USD pair might face further downward pressure as the US Dollar gains traction amidst heightened market caution about the Federal Reserve’s future policy moves, following cautious comments from Fed members.
China reported a trade balance of CNY585.96 billion, a decrease from the previous CNY743.56 billion. Exports from China increased by 7.2% year-over-year in June, an improvement over April’s 6.3%. Imports rose by 2.3% year-over-year in June, a recovery from the previous 2.1% decline.
In US Dollar terms, China’s trade surplus widened more than expected in June. The trade balance stood at +$114.77 billion compared to the +$109 billion expected and +$103.22 billion previously. Exports grew by 5.8% year-over-year, surpassing the 5% forecast and previous 4.8%. Imports increased by 1.1% year-over-year, slightly below the 1.3% expected after a 3.4% decline previously.
A Chinese customs spokesperson emphasized that despite challenges, China’s export sector is expected to continue its growth trajectory. It’s important to note that changes in Chinese economic indicators are significant for the AUD due to the close trade relations between Australia and China.
The Australian mining giant BHP signed a memorandum of understanding with Chinese battery manufacturer CATL to explore collaboration in battery technology for mining equipment and locomotives, including fast-charging infrastructure. They will also evaluate opportunities in energy storage systems and battery recycling for BHP’s operations.
The Reserve Bank of Australia (RBA) is likely to maintain interest rates in August to curb inflation and achieve a sustainable target of 2.5%. RBA Governor Michele Bullock highlighted persistent inflation risks, citing high unit labor costs and low productivity as key factors. RBA Deputy Governor Andrew Hauser pointed out the growing global economic uncertainty and the significant potential impact of tariffs on the global economy.
Australian Dollar Weakens Amidst Global Trade Uncertainties
- The US Dollar Index (DXY) remains subdued, reflecting ongoing global trade tensions.
- President Trump’s new tariffs on the EU and Mexico are set to begin on August 1, potentially escalating international trade disputes.
- Comments by Chicago Fed President Austan Goolsbee suggest that continuous tariff threats by Trump could limit the Fed’s ability to reduce rates as desired by the market and the administration.
- The US government’s budget surplus in June was bolstered by a significant increase in customs duties, influenced by Trump’s tariff policies.
- Minutes from the Federal Open Market Committee (FOMC) meeting in June showed a cautious stance on future rate adjustments.
- Changes in China’s Consumer Price Index and Producer Price Index in June could impact the AUD, given the economic ties between China and Australia.
- A survey indicated expectations for a rate cut by the RBA, supported by predictions from Australia’s four major banks.
- Australian Treasurer Jim Chalmers discussed the implications of the RBA’s recent decision to hold rates, indicating a clear direction on future monetary policy.
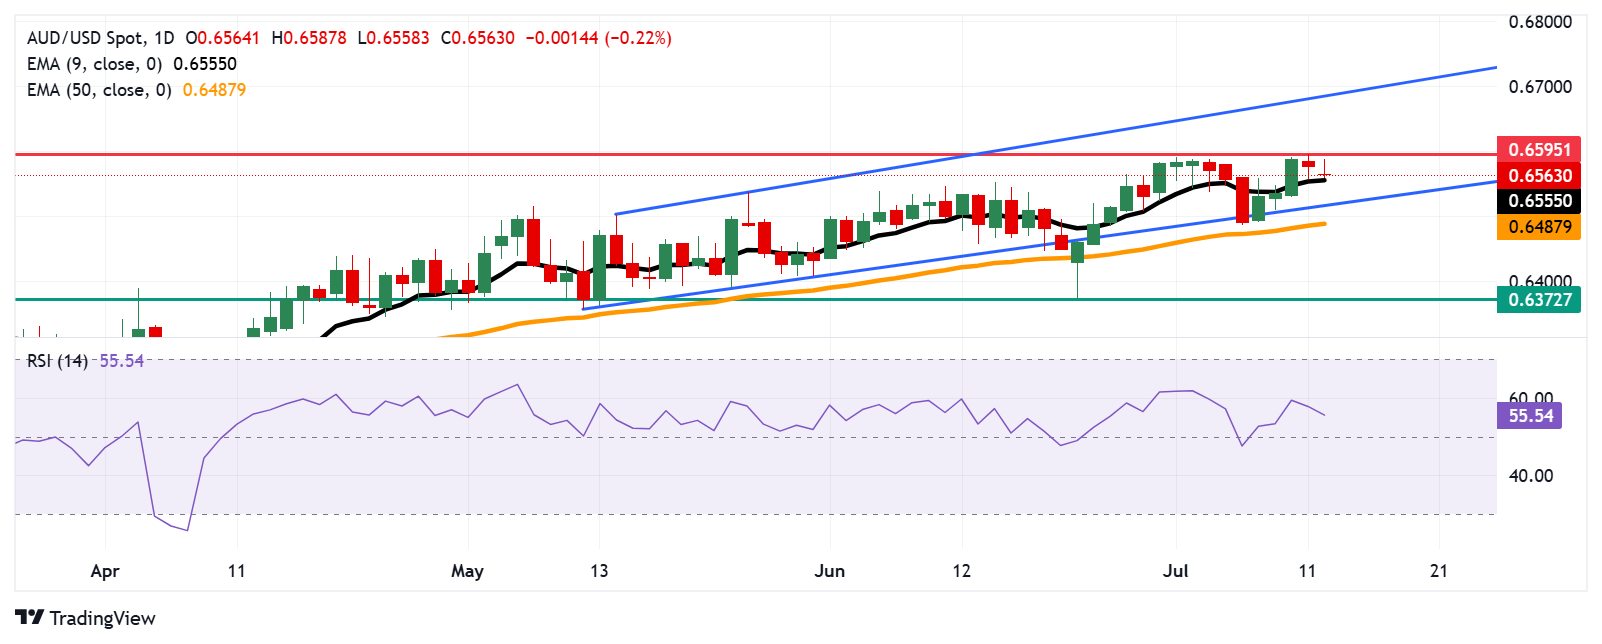
Australian Dollar Trends Near Nine-Day EMA
The AUD/USD pair is trading around 0.6560, showing signs of upward movement within an ascending channel pattern. The 14-day Relative Strength Index (RSI) is above 50, supporting the bullish outlook. The pair is also slightly above the nine-day Exponential Moving Average (EMA), suggesting continued short-term upward momentum.
On the upside, breaking above the recent high of 0.6595 could further affirm the bullish trend, potentially reaching towards the upper boundary of the channel at 0.6690.
Conversely, a dip below the nine-day EMA at 0.6555 could shift market sentiment to bearish, testing lower support levels within the channel.
AUD/USD: Daily Chart Analysis
Australian Dollar PRICE Today
The table below shows the percentage change of the Australian Dollar (AUD) against major currencies today, highlighting its position as the weakest against the Swiss Franc.
| USD | EUR | GBP | JPY | CAD | AUD | NZD | CHF | |
|---|---|---|---|---|---|---|---|---|
| USD | -0.05% | 0.13% | 0.04% | -0.02% | 0.01% | 0.26% | -0.05% | |
| EUR | 0.05% | 0.16% | 0.09% | 0.00% | 0.04% | 0.30% | -0.01% | |
| GBP | -0.13% | -0.16% | -0.12% | -0.15% | -0.11% | 0.15% | -0.03% | |
| JPY | -0.04% | -0.09% | 0.12% | 0.05%</td | -0.03% | 0.28% | -0.04% | |
| CAD | 0.02% | -0.01% | 0.15% | -0.05% | 0.03% | 0.30% | -0.02% | |
| AUD | -0.01% | -0.04% | 0.11% | 0.03% | -0.03% | 0.23% | -0.05% | |
| NZD | -0.26% | -0.30% | -0.15% | -0.28% | -0.30% | -0.23% | -0.31% | |
| CHF | 0.05% | 0.00% | 0.03% | 0.04% | 0.02% | 0.05% | 0.31% |
This heat map shows the percentage changes of major currencies against each other. The base currency is selected from the left column, while the quote currency is selected from the top row. For instance, selecting the Australian Dollar from the left and moving horizontally to the US Dollar displays the percentage change in the corresponding box, representing AUD (base)/USD (quote).


Recent News


Leave a Comment