

- Australian Dollar Faces Downward Pressure Amid Middle East Tensions
- China’s Retail Sales Exceed Expectations with a 6.4% Increase in May
- Iran Launches Missile Strikes on Israeli Targets Amid Ongoing Conflict
The Australian Dollar (AUD) continues to weaken against the US Dollar (USD) as geopolitical tensions in the Middle East escalate. The AUD/USD pair has been under pressure for two consecutive sessions, influenced by developments between Israel and Iran and economic data from China, a major trading partner of Australia.
China’s Retail Sales saw a significant rise of 6.4% year-over-year in May, surpassing both the expected 5.0% and the previous month’s 5.1% increase. Meanwhile, Industrial Production grew by 5.8% YoY, slightly below the forecast of 5.9% and the previous 6.1%. The National Bureau of Statistics (NBS) of China indicated that the domestic economy has been stable in the first half of 2025 but faces challenges due to uncertain trade policies.
The conflict between Israel and Iran continues with no signs of de-escalation, despite international calls for diplomacy. Iran’s Revolutionary Guard launched multiple missile strikes targeting Israeli military and industrial sites.
According to local officials, the conflict has resulted in 224 fatalities in Iran and 14 in Israel, with over 1,277 injuries reported. Iran has communicated through mediators that it will not engage in negotiations while under attack.
Australian Dollar Struggles as US Dollar Gains Amid Global Tensions
- The US Dollar Index (DXY) is showing signs of recovery, currently trading higher at around 98.10.
- The University of Michigan reported a rise in Consumer Sentiment Index to 60.5 in June, higher than the expected 53.5.
- The US Producer Price Index (PPI) saw a slight increase of 0.1% MoM in May, below the anticipated 0.2% rise.
- Expectations are set for the US Federal Reserve to maintain its policy rate, with market speculation about a potential rate cut by September.
- President Trump announced an expansion of steel tariffs, affecting a broader range of imported products.
- Recent statements from President Trump suggest a nearing trade deal with China, pending final approvals.
- China aims to control critical mineral exports to the US, potentially using them as leverage in future negotiations.
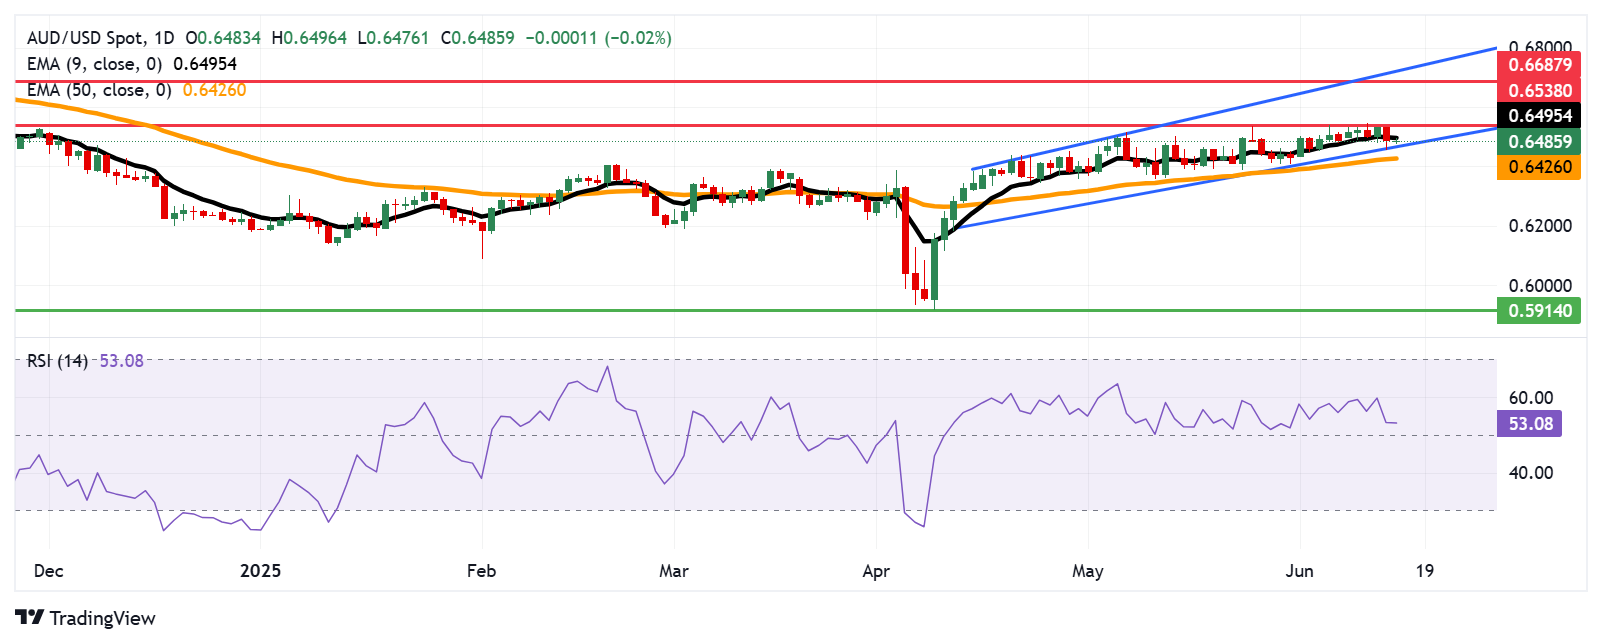
Australian Dollar Remains Below Key Resistance Level
The AUD/USD pair is currently trading near 0.6480, with technical indicators showing a mix of bullish and bearish signals. The pair is below the nine-day Exponential Moving Average (EMA), indicating weaker short-term momentum.
Resistance is seen at the nine-day EMA of 0.6495, with further upside potential towards the seven-month high of 0.6538. On the downside, a break below the ascending channel could push the pair towards the 50-day EMA at 0.6425.
(Correction: The previous reference to “The US Michigan Consumer Sentiment will be eyed later on Friday” in the first market mover was removed on June 16 at 3:54 GMT.)
AUD/USD: Daily Chart
Australian Dollar PRICE Today
Below is a table showing the percentage change of the Australian Dollar (AUD) against major currencies today. The Australian Dollar was notably weaker against the British Pound.
| USD | EUR | GBP | JPY | CAD | AUD | NZD | CHF |
|---|
The heat map shows percentage changes of major currencies against each other. Pick the base currency from the left column and the quote currency from the top row to see the percentage change.


Recent News


Leave a Comment