

- Australian Dollar Gains as US Dollar Faces Headwinds from Economic Uncertainties.
- ANZ Job Advertisements See a Decline, Adding to Economic Concerns in Australia.
- US President Trump Proposes Doubling Tariffs on Steel and Aluminum Imports.
The Australian Dollar (AUD) has shown strength against the US Dollar (USD), appreciating by over 0.50% on Monday. The AUD/USD pair is on the rise as the US Dollar could face obstacles amid escalating concerns about sluggish economic growth and persistent inflation in the United States. Additionally, US President Donald Trump has announced plans to increase tariffs on steel and aluminum imports to 50%, up from the current 25%.
Employment prospects in Australia appear dim as ANZ Job Advertisements dropped by 1.2% in May, following a revised 0.3% decrease in April. This marks the second consecutive month of decline in job ads. Furthermore, the S&P Global Manufacturing Purchasing Managers’ Index (PMI) for Australia fell to 51.0 in May from 51.7 in the previous month, reaching its lowest point since February.
The AUD remains resilient after mixed data from the Chinese Manufacturing PMI. According to the National Bureau of Statistics (NBS), China’s Manufacturing PMI edged up to 49.5 in May from 49.0 in April, while the Non-Manufacturing PMI slightly declined to 50.3 from 50.4, missing forecasts of 50.6. As a significant trading partner, China’s economic performance can significantly influence the Australian Dollar.
Australian Dollar Strengthens Amid US Economic Concerns
- The US Dollar Index (DXY), which tracks the performance of the Greenback against a basket of six major currencies, is currently near 99.50. Market participants are awaiting the US ISM Manufacturing PMI for May, expected later today, for further trading cues.
- At a recent rally in Pennsylvania, President Trump reiterated his intention to escalate tariffs on steel and aluminum to fortify the US steel industry and intensify the ongoing trade disputes.
- A federal court has temporarily blocked President Trump’s proposed “Liberation Day” tariffs, ruling that the President exceeded his authority. However, the US Court of Appeals for the Federal Circuit has allowed the tariffs to proceed temporarily.
- Minutes from the latest Federal Open Market Committee (FOMC) meeting reflect a consensus among Fed officials to maintain a cautious approach to interest rate adjustments amid heightened economic uncertainty.
- Reports from China’s Securities Times suggest potential measures by the People’s Bank of China (PBoC) to enhance economic support through Pledged Supplementary Lending (PSL) to policy banks.
- Australia’s Retail Sales slightly declined by 0.1% month-over-month in April, contrary to expectations of a 0.3% increase. Additionally, Building Permits fell significantly by 5.7%.
- The Reserve Bank of Australia (RBA) is poised to cut interest rates further in response to economic challenges, including the impact of US-China trade tensions, according to RBA Governor Michele Bullock.
Australian Dollar Climbs from Key Technical Levels
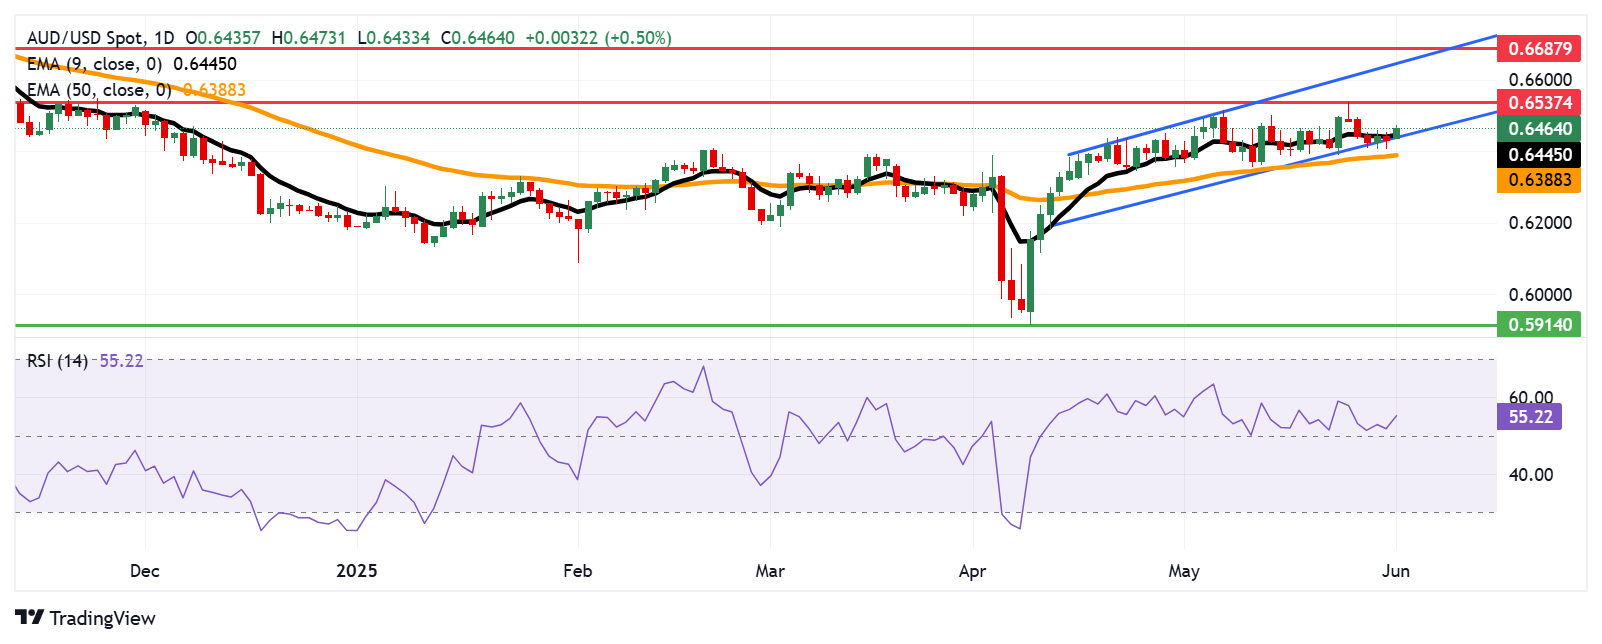
The AUD/USD pair is trading near 0.6460, showing signs of a bullish trend as it moves above the nine-day Exponential Moving Average (EMA). The 14-day Relative Strength Index (RSI) is also advancing above 50, indicating sustained buying interest.
Should the AUD/USD pair breach the resistance at 0.6537, a seven-month high, it may continue to ascend towards the upper boundary of its current ascending channel near 0.6650. Conversely, a dip below the support at 0.6445 could pressure the pair to test lower support levels.
Daily Technical Analysis of AUD/USD
Today’s Australian Dollar Performance
The table below displays the daily percentage changes of the Australian Dollar against various major currencies. Notably, the Australian Dollar was strongest against the US Dollar.
| USD | EUR | GBP | JPY | CAD | AUD | NZD | CHF | |
|---|---|---|---|---|---|---|---|---|
| USD | -0.14% | -0.15% | -0.23% | -0.14% | -0.34% | -0.62% | -0.11% | |
| EUR | 0.14% | -0.03% | -0.08% | -0.02% | -0.20% | -0.51% | 0.02% | |
| GBP | 0.15% | 0.03% | -0.04% | 0.00% | -0.17% | -0.49% | 0.05% | |
| JPY | 0.23% | 0.08% | 0.04% | 0.06% | -0.14% | -0.43% | 0.01% | |
| CAD | 0.14% | 0.02% | -0.01% | -0.06% | -0.19% | -0.49% | 0.04% | |
| AUD | 0.34% | 0.20% | 0.17% | 0.14% | 0.19% | -0.25% | 0.31% | |
| NZD | 0.62% | 0.51% | 0.49% | 0.43% | 0.49% | 0.25% | 0.54% | |
| CHF | 0.11% | -0.02% | -0.05% | -0.01% | -0.04% | -0.31% | -0.54% |
This heat map illustrates the percentage changes of major currencies relative to each other. The base currency is selected from the left column, and the quote currency from the top row. For instance, selecting the Australian Dollar from the left and the US Dollar from the top shows the percentage change of AUD against USD in the corresponding cell.


Recent News


Leave a Comment