

- EUR/JPY steadies amid rising US trade tensions with Japan and the EU.
- Anticipation builds around ECB’s upcoming rate decision impacting EUR/JPY.
- EUR/JPY maintains position above key technical resistance level.
The Euro (EUR) is currently experiencing limited movement against the Japanese Yen (JPY), with mounting trade disputes between the United States and its principal allies capturing market attention.
Amid ongoing trade negotiations, the EUR/JPY pair hovers around the 172.00 mark.
Impending US tariffs prompt readiness from Japan and the EU
As the August 1 deadline approaches for increased US tariffs, both Japan and the European Union are gearing up for potential impacts. These developments come as trade negotiations hit a pivotal phase.
The prospect of an expanded trade conflict looms, influencing market sentiment, especially in economies like Japan and the Eurozone that are heavily dependent on exports.
Japan’s lead trade negotiator, Ryosei Akazawa, is engaged in critical discussions in Washington, marking the eighth round aimed at mitigating further tariff impositions.
Concurrently, EU representatives are strategizing from Brussels, with no high-level EU-US face-to-face meetings scheduled yet.
The outcomes of these discussions, particularly around July 22-23, are crucial, with the US poised to implement a 30% tariff on EU goods if negotiations fail.
In retaliation, the EU has prepared countermeasures that could affect US digital services and aerospace products.
ECB’s rate decision: A potential game-changer for EUR/JPY dynamics
The Eurozone also faces significant event risk with the European Central Bank’s (ECB) rate decision due this Thursday.
Although no changes in policy are expected immediately, the upcoming Monetary Policy Statement and press briefing will likely provide insights into the ECB’s views on inflation and economic growth, possibly influencing future policy adjustments.
This ECB event could significantly affect interest rate differentials, potentially altering the short-term trajectory of EUR/JPY.
Technical Analysis: EUR/JPY tests resistance levels
Technically, EUR/JPY is seeing a consolidation phase just above the 10-day Simple Moving Average (SMA) at 170.90, with resistance seen near the recent peak of 172.94.
A decisive break above this resistance could pave the way towards 173.50, with additional resistance around the July 2024 peak at 175.43.
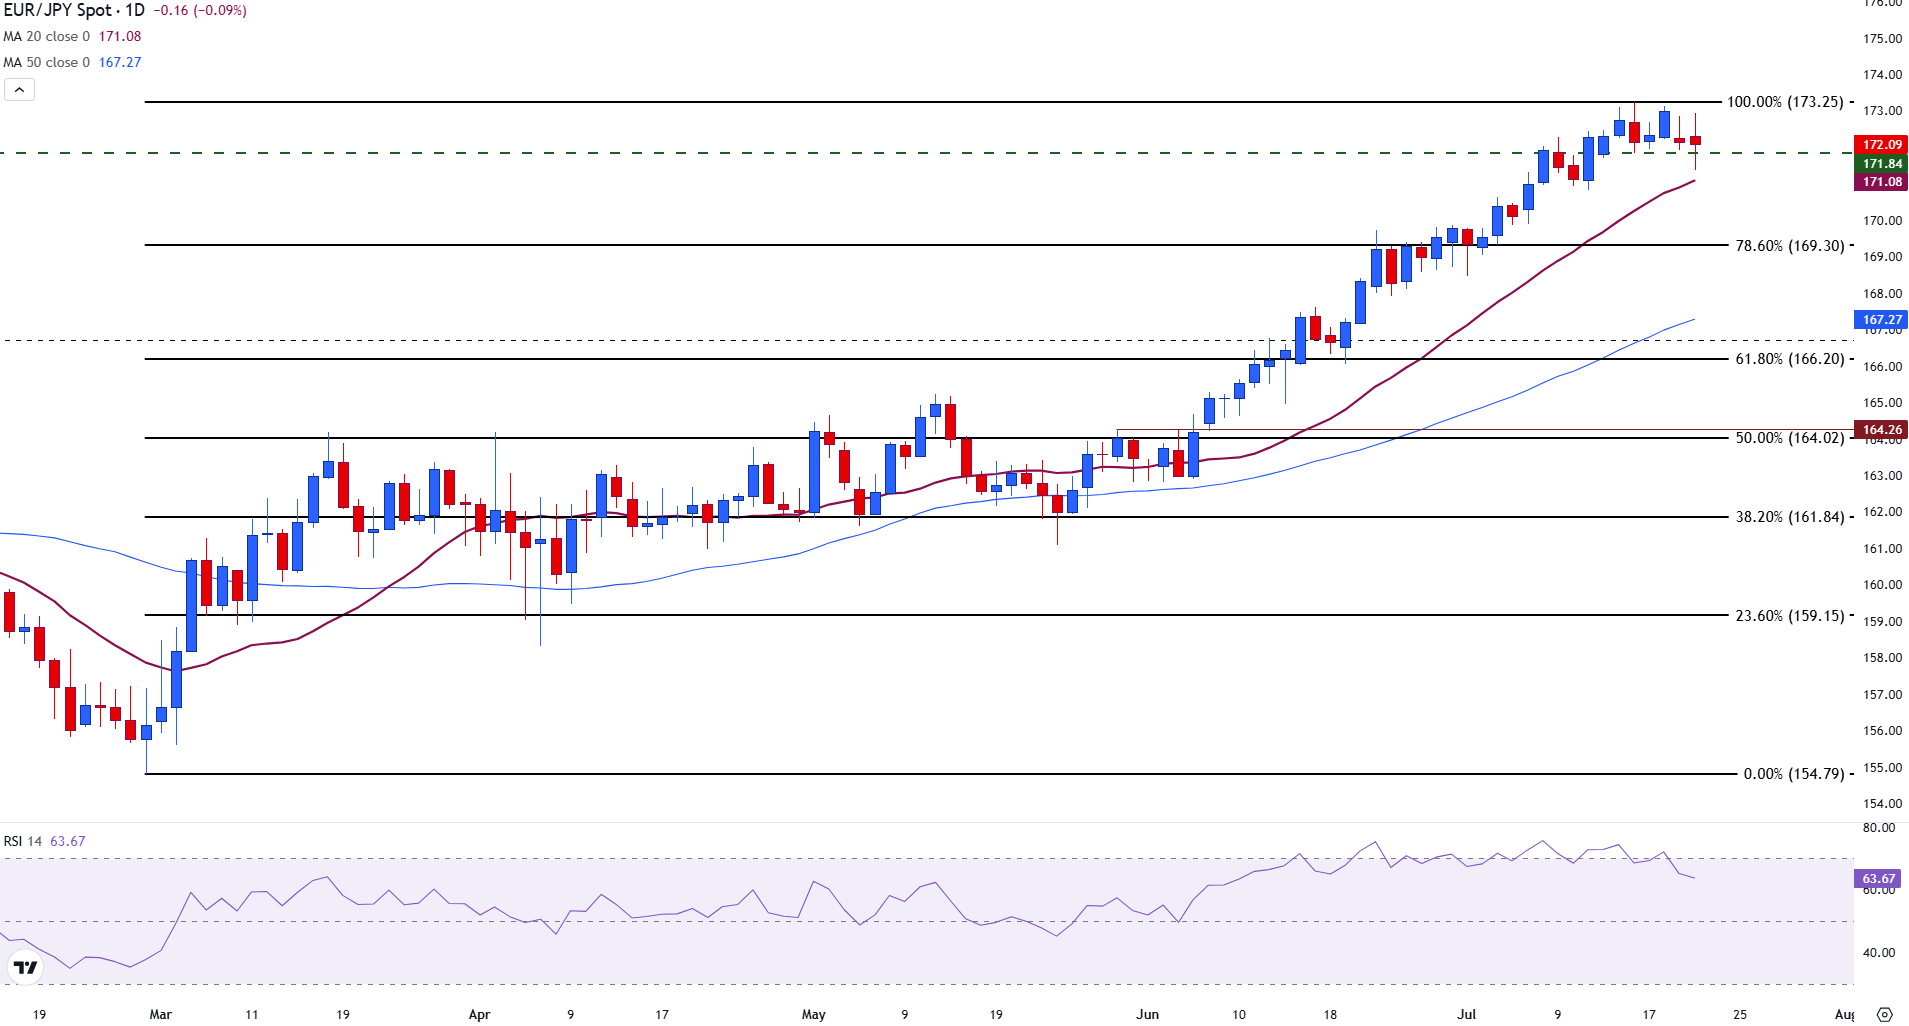
EUR/JPY daily chart
On the downside, support is initially found at 170.50, with further support likely in the 169.70–170.00 range, where the 20-day SMA and prior lows meet.
The Relative Strength Index (RSI) is currently near 64, indicating a potential slowdown in bullish momentum as it exits the overbought zone.


Recent News


Leave a Comment