

- GBP/USD Gains as US CPI Data Falls Short of Expectations
- Upcoming US PPI Could Reinforce Trends of Slowing Inflation
- Concerns Over UK’s Fiscal Health Intensify Amid £2T Budget Announcement
The GBP/USD pair saw an uptick during Wednesday’s North American trading session, spurred by a US inflation report that didn’t meet expectations. This has led to increased speculation that the Federal Reserve might implement two rate cuts by 2025. Currently, GBP/USD is trading at 1.3537, marking a 0.34% increase.
GBP/USD Climbs Above 1.35 as Weak US Inflation Data Fuels Rate Cut Speculations
May’s Consumer Price Index (CPI) in the US showed a smaller increase than anticipated, rising 2.4% year-over-year against predictions of a 2.5% increase. The core CPI, which excludes food and energy prices, remained steady at 2.8% year-over-year.
While the inflation data could lead to a more dovish stance from the Fed, recent ISM Purchasing Managers Index (PMI) surveys indicate rising input costs for businesses. The market is now looking towards Thursday’s release of the Producer Price Index (PPI) for further clues on the inflation trajectory.
According to Bloomberg, the series of inflation figures falling below forecasts suggests that the impact of tariffs has yet to significantly affect consumer prices.
In the UK, Chancellor Rachel Reeves has introduced a £2 trillion budget aimed at revitalizing the nation, with significant investments planned in health, education, and infrastructure, as reported by the Financial Times. However, this massive fiscal expenditure has raised concerns about the UK’s financial health, pushing the yield on 30-year Gilts to the highest among G7 countries.
Looking ahead, the US economic schedule includes the PPI and Initial Jobless Claims on Thursday. Meanwhile, the Bank of England is expected to maintain its current interest rates in the upcoming week.
GBP/USD Price Forecast: Technical Analysis
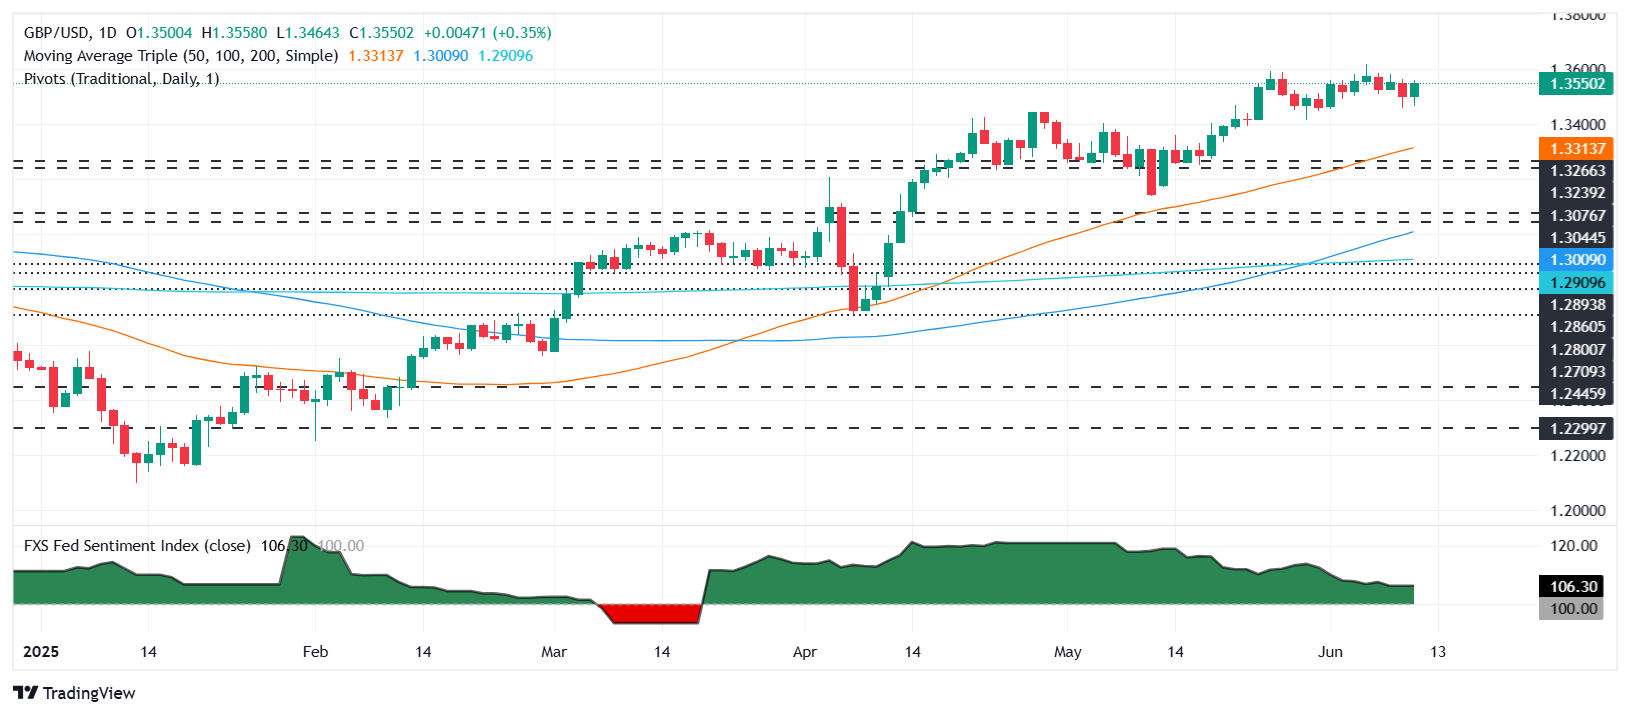
The GBP/USD pair appears to have found a floor near 1.3450 over the past two days and has since breached the 20-day Simple Moving Average (SMA) at 1.3515, indicating a bullish momentum.
If GBP/USD surpasses the 1.3600 level, it could challenge the annual high at 1.3616 and potentially reach up to 1.3700. On the downside, the first line of support is at the 20-day SMA and the 1.3500 level. A break below could see prices testing the May 29 daily low of 1.3412.
British Pound PRICE This week
The table below shows the percentage change of the British Pound (GBP) against major currencies this week. The British Pound was notably strong against the US Dollar.
| USD | EUR | GBP | JPY | CAD | AUD | NZD | CHF | |
|---|---|---|---|---|---|---|---|---|
| USD | -0.80% | -0.16% | -0.25% | -0.23% | -0.35% | -0.43% | -0.25% | |
| EUR | 0.80% | 0.63% | 0.56% | 0.57% | 0.47% | 0.36% | 0.54% | |
| GBP | 0.16% | -0.63% | 0.00% | -0.06% | -0.15% | -0.27% | -0.09% | |
| JPY | 0.25% | -0.56% | 0.00% | 0.02% | -0.16% | -0.24% | -0.13% | |
| CAD | 0.23% | -0.57% | 0.06% | -0.02% | -0.15% | -0.20% | -0.03% | |
| AUD | 0.35% | -0.47% | 0.15% | 0.16% | 0.15% | -0.10% | 0.07% | |
| NZD | 0.43% | -0.36% | 0.27% | 0.24% | 0.20% | 0.10% | 0.18% | |
| CHF | 0.25% | -0.54% | 0.09% | 0.13% | 0.03% | -0.07% | -0.18% |
This heat map displays the percentage changes of major currencies relative to each other. The base currency is selected from the left column, and the quote currency from the top row. For instance, selecting the British Pound from the left column and moving horizontally to the US Dollar shows the percentage change in the box, representing GBP (base)/USD (quote).


Recent News


Leave a Comment