

- US Dollar Index Shows Signs of Recovery, Ending a Nine-Day Decline.
- US Dollar Records Its Worst First-Half Performance in Over Four Decades.
- Senate Approves Trump’s $3.3 Trillion Fiscal Bill; Focus Now on House Vote.
Amid ongoing selling pressure, the US Dollar Index (DXY) reached a low of 96.38, marking its weakest point since February 2022. This occurred during early trading on Tuesday.
The dollar, however, managed a modest rebound in the American trading session, with the DXY last noted at around 96.85. This recovery was bolstered by positive US economic reports. A robust ISM Manufacturing PMI and solid JOLTS job openings figures helped mitigate some of the bearish sentiment, although concerns about US fiscal health, tariff uncertainties, and increased political pressures on the Federal Reserve persist.
Marking its poorest performance since the start of floating exchange rates in 1973, the DXY declined over 10% in the first half of 2025. This included the largest quarterly drop since the fourth quarter of 2022, with the US Dollar weakening against all major G10 currencies as investors moved away from dollar-based assets.
The sharp depreciation of the US Dollar over the recent quarter has been largely attributed to erratic trade and economic policies under US President Donald Trump. His expansive fiscal proposal, dubbed the “One Big Beautiful Bill,” has sparked investor anxiety due to its potential to significantly increase the national debt by over $3.3 trillion, raising alarms over fiscal instability.
Further compounding these concerns, Trump’s aggressive tariff agenda continues to add layers of uncertainty to global trade and economic policies. With the July 9 deadline fast approaching, only preliminary agreements with the UK and a de-escalation with China have been achieved, while negotiations with other key trade partners have stalled. The administration is also moving away from its ambitious plan of “90 trade deals in 90 days,” focusing instead on interim agreements while maintaining a 10% import tax that impacts US consumers.
Market Influences: Rate Cut Expectations, Political Pressures, and Tariff Implications
- Following a closely contested session, the Senate passed President Trump’s $3.3 trillion fiscal package with Vice President J.D. Vance casting the decisive vote. This extensive bill proposes permanent tax reductions, significant entitlement reforms, and an increase in the debt ceiling by $5 trillion.
- The fiscal package includes $4.5 trillion in tax cuts, extending Trump’s 2017 tax rates and introducing new incentives such as zero taxes on tips, alongside $1.2 trillion in cuts to programs like Medicaid and food stamps. It also proposes a $350 billion plan for border security and cuts to green energy incentives.
- The bill now heads back to the House, where Speaker Mike Johnson has expressed concerns over the Senate’s amendments, with the deadline for Trump’s Fourth of July looming.
- The June ISM Manufacturing PMI indicated a slower contraction in manufacturing activity, rising to 49.0 from 48.5 in May, slightly above forecasts. Job openings surged by 374,000 to 7.769 million in May, the highest since November 2024, signaling ongoing strength in the labor market.
- Political pressures continue to affect the US Dollar as President Trump extends his criticism to the entire Federal Reserve Board, advocating for a significant rate cut to “1% or better.” Treasury Secretary Scott Bessent supported this view, downplaying inflation risks from tariffs and suggesting a hesitancy among Fed officials in their policy responses.
- US 2-year Treasury yields have fallen to a two-month low of 3.71%, with market expectations leaning towards a 125 basis point rate cut over the next year, as indicated by Fed funds futures.
- With the tariff pause set to expire on July 9, President Trump has indicated he will not extend it, planning to notify countries of new tariff rates if no agreements are reached.
- At the ECB Forum on Central Banking, Fed Chair Jerome Powell maintained a cautious stance, suggesting that while inflation might rise over the summer, the Fed is prepared to wait and see, reinforcing expectations for a possible rate cut in September.
Technical Analysis: US Dollar Weakens Below Key Support Levels
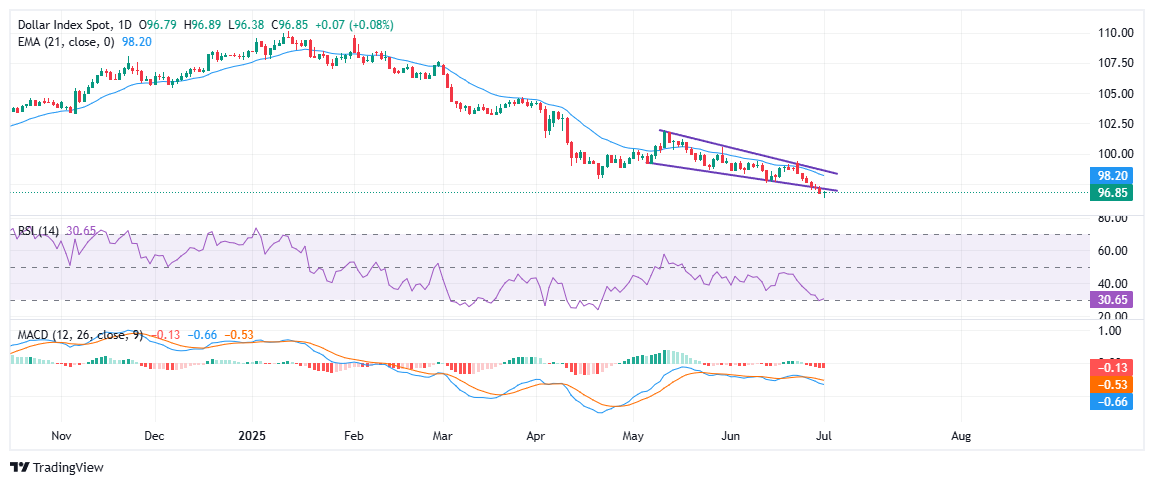
The US Dollar Index (DXY) remains under significant bearish pressure, recently breaking below the lower boundary of a descending wedge pattern that has been in place since mid-May. Currently trading around 96.85, the DXY is struggling to hold above the wedge’s lower boundary after a slight rebound from an intraday low of 96.38, staying well below its 21-day Exponential Moving Average at 98.20. This consistent rejection from the EMA underscores the ongoing downtrend. The breakdown from the wedge pattern suggests an acceleration in bearish momentum, with the next significant support level anticipated around the 96.00 mark.
Momentum indicators like the Relative Strength Index (RSI) have dropped to 27.59, entering oversold territory, which might hint at a potential short-term recovery. However, it also reflects the intensity of the current selling pressure. The Moving Average Convergence Divergence (MACD) histogram remains in negative territory, with the MACD line widening below the signal line, further confirming the bearish trend. Unless the DXY can reclaim and maintain above the 98.00–97.80 zone, the path of least resistance continues to be downward.


Recent News


Leave a Comment